

![Joel Rosenthal [Image by creator from ]](/media/images/Joel_Rosenthal.2e16d0ba.fill-500x500.jpg)
Federal Reserve Indicators are Predictors of Collection Industry Accounts Volume.
If I had a crystal ball in my office that predicted business volume, I’d use it—you likely would, too! And yet, several reputable indicators can help you anticipate volume. The Federal Reserve releases its report on credit card charge-offs and delinquencies each quarter. These data points help indicate industry account volume, especially considering that 80% or more of the NCBA member firms’ collective volume is credit card related.
[article_ad]
In ProVest’s experience, we generally see a 9-12-month lag from when the charge-offs occur before our litigation clients see the volume. Additionally, delinquencies are a 3–6-month early indicator of charge-off volume. What does this mean?
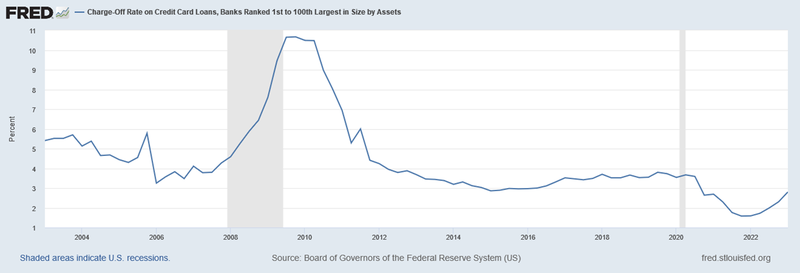
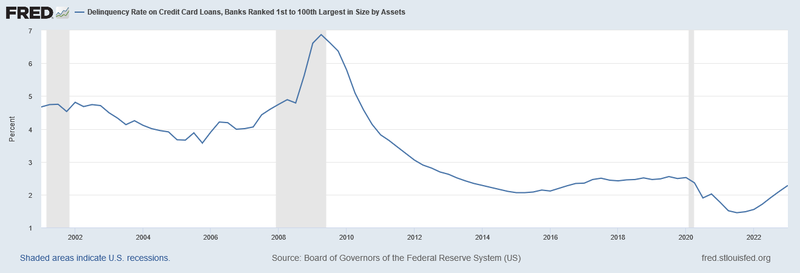
Based on this timeline, our clients will likely see their account volume continuing to increase throughout the year and into early 2024. According to the recent report’s data, the trend is favorable. Charge-offs increased from Q4 to Q1 from 2.30 to 2.80%; delinquencies rose from 2.10 to 2.28% during the same period.
Charge-offs are now more than halfway recovered from the COVID low of 1.58% to the pre-pandemic high of about 3.70%. Delinquencies are nearly back from a pre-COVID high of 2.5% from the pandemic’s low of 1.45%. This indicates that a continued rebound of charge-off volume should be expected.
The Federal Reserve’s charts for the data I reference follow. The charts are easily downloadable in several formats. The next quarterly results will be released toward the end of August 2023.
Charge-off Rate on Credit Card Loans (link to data)
Delinquency Rate on Credit Card Loans (link to data)
While it seems early to start thinking about 2024 plans and strategies—since it is the summer, after all—based on key indicators—the industry’s account volume will continue to grow.
![the word regulation in a stylized dictionary [Image by creator from ]](/media/images/Credit_Report_Disputes.max-80x80.png)
![Cover image for New Agent Onboarding Manuals resource [Image by creator from insideARM]](/media/images/New_Agent_Onboarding_Manuals.max-80x80_3iYA1XV.png)

![[Image by creator from ]](/media/images/Finvi_Tech_Trends_Whitepaper.max-80x80.png)
![[Image by creator from ]](/media/images/Collections_Staffing_Full_Cover_Thumbnail.max-80x80.jpg)
![Report cover reads One Conversation Multiple Channels AI-powered Multichannel Outreach from Skit.ai [Image by creator from ]](/media/images/Skit.ai_Landing_Page__Whitepaper_.max-80x80.png)
![Report cover reads Bad Debt Rising New ebook Finvi [Image by creator from ]](/media/images/Finvi_Bad_Debt_Rising_WP.max-80x80.png)
![Report cover reads Seizing the Opportunity in Uncertain Times: The Third-Party Collections Industry in 2023 by TransUnion, prepared by datos insights [Image by creator from ]](/media/images/TU_Survey_Report_12-23_Cover.max-80x80.png)
![[Image by creator from ]](/media/images/Skit_Banner_.max-80x80.jpg)